Processing...
Nouvelle publication parue dans la revue Psychophysiology
Interindividual differences in brain dynamics of early visual processes: Impact on score accuracy in the mental rotation task. Auteurs: Paolo Ruggeri Nam Nguyen Alan J. Pegna Catherine Brandner
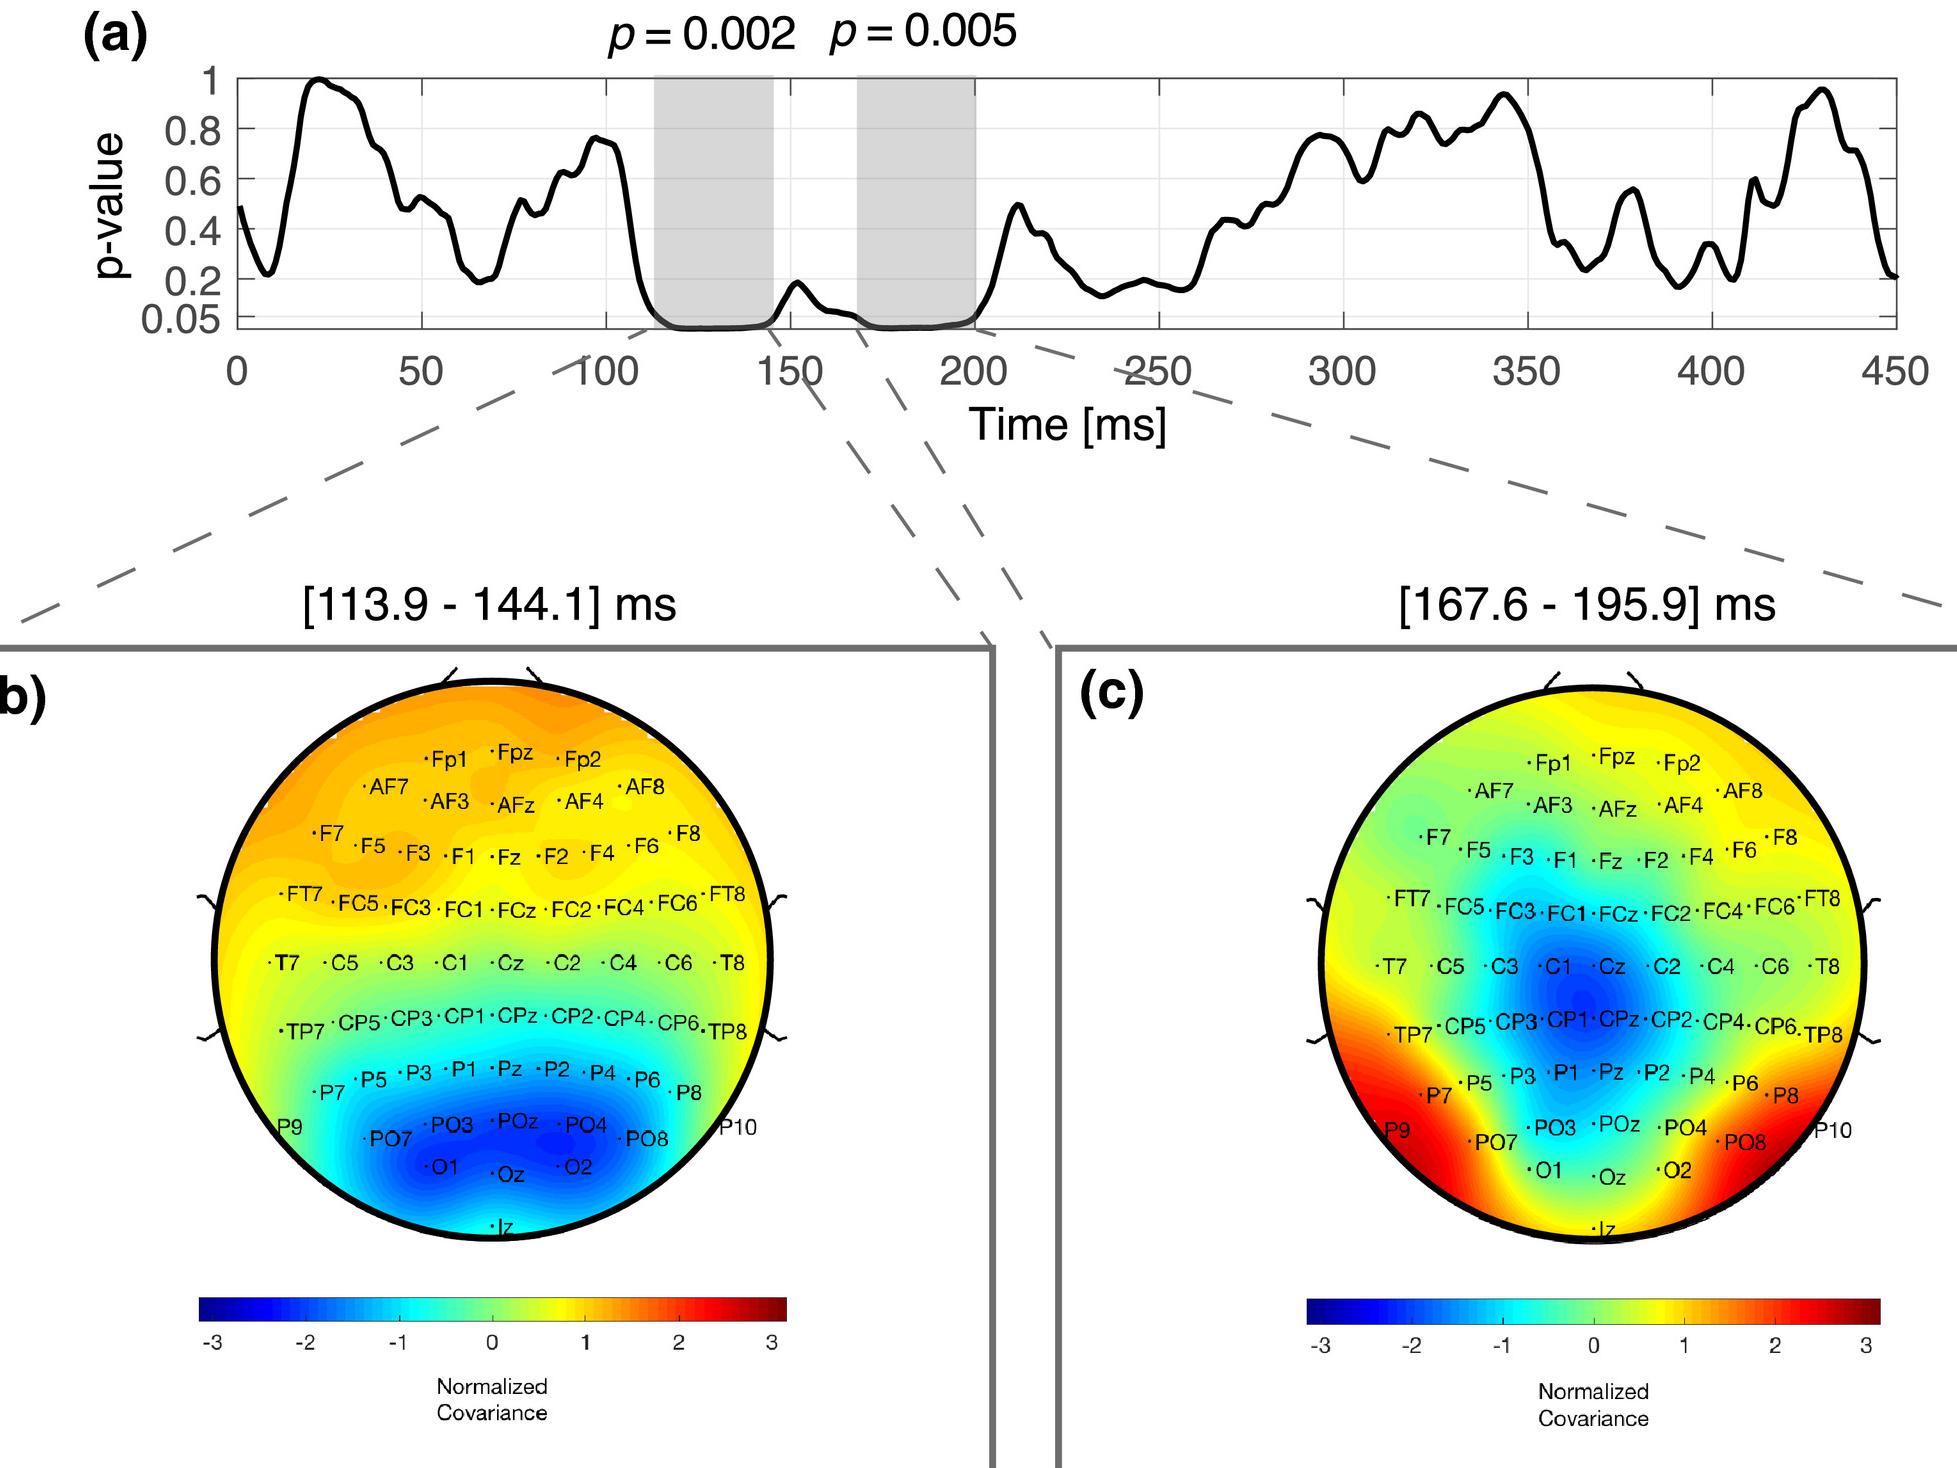
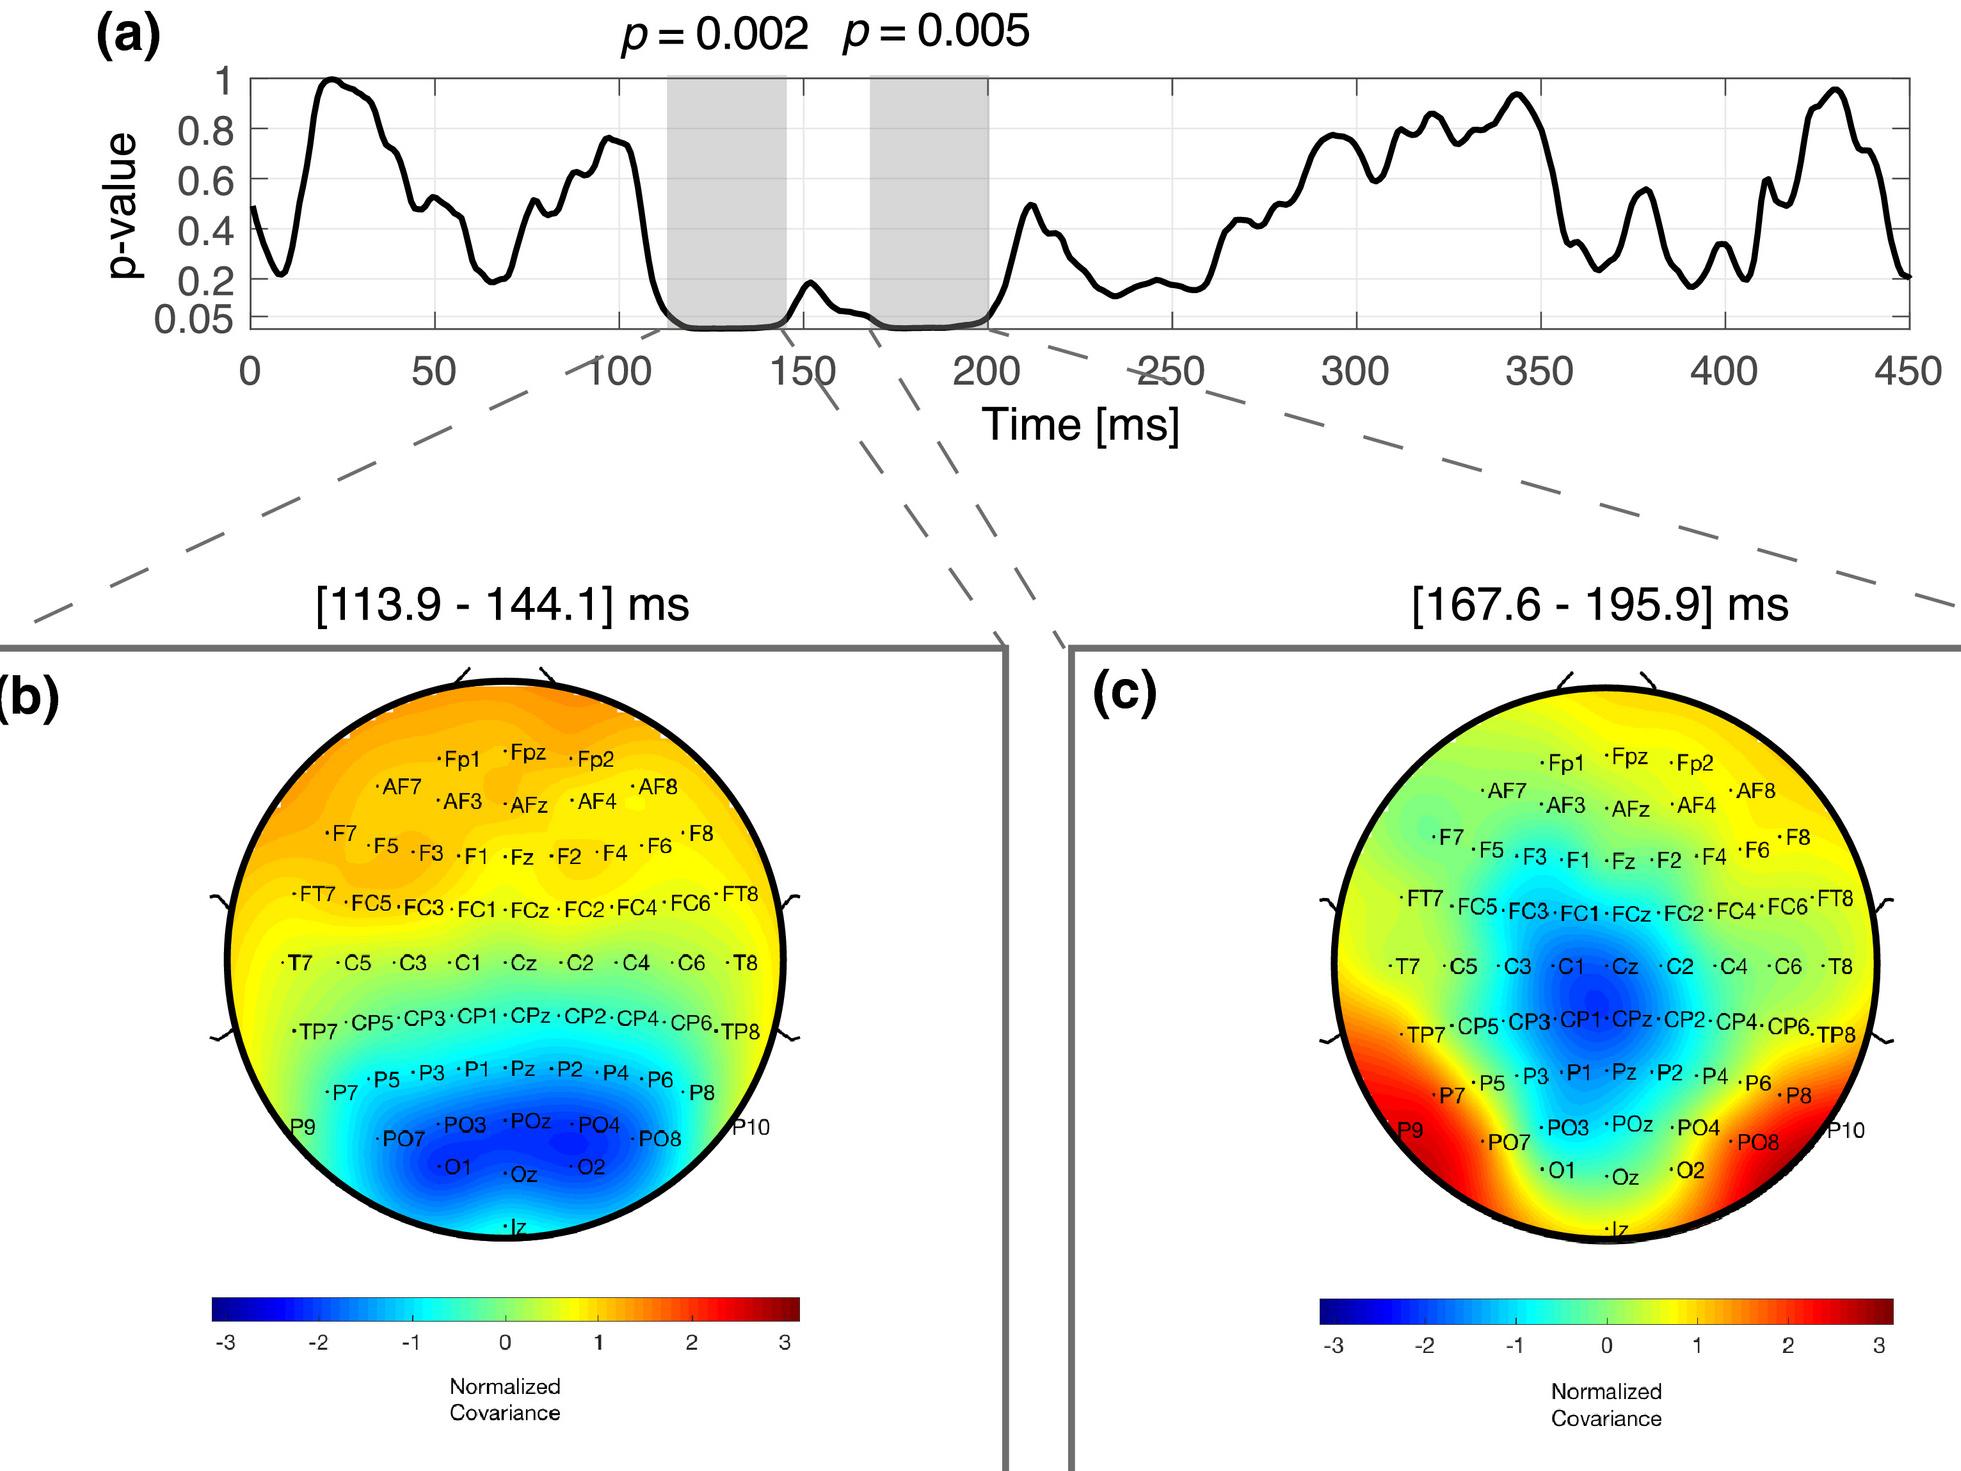
Results of the TANCOVA analysis performed using the ERPs and the accuracy scores of the MR condition. (a) The p value of the TANCOVA is plotted as a function of time. The grey shadowed areas highlight the time periods of significant covariation of ERP topographies and accuracy scores. (b) and (c) The mean topographies of the covariance maps observed from 113.9 to 144.1ms and from 167 to 195.9ms (top) are illustrated. The graphs below indicate the results of the linear regression analysis performed between their observed strengths in the ERPs and the accuracy scores